Predicting Taxi Tips with Regression Trees
Train and evaluate a DecisionTreeRegressor on NYC taxi trip data to predict tip amounts.

Estimated reading time: ~20 minutes
Introduction
This article builds a regression tree model to predict taxi trip tips using a public NYC dataset. We explore feature-target correlations, train a DecisionTreeRegressor, and report MSE and R² on a held-out test set.
All figures are pre-rendered; code below is for reference only and does not execute when compiling the article.
Imports and data loading
import numpy as np
import pandas as pd
import matplotlib.pyplot as plt
from sklearn.model_selection import train_test_split
from sklearn.preprocessing import normalize
from sklearn.tree import DecisionTreeRegressor
from sklearn.metrics import mean_squared_error

url = 'https://cf-courses-data.s3.us.cloud-object-storage.appdomain.cloud/pu9kbeSaAtRZ7RxdJKX9_A/yellow-tripdata.csv'
raw_data = pd.read_csv(url)
raw_data.head()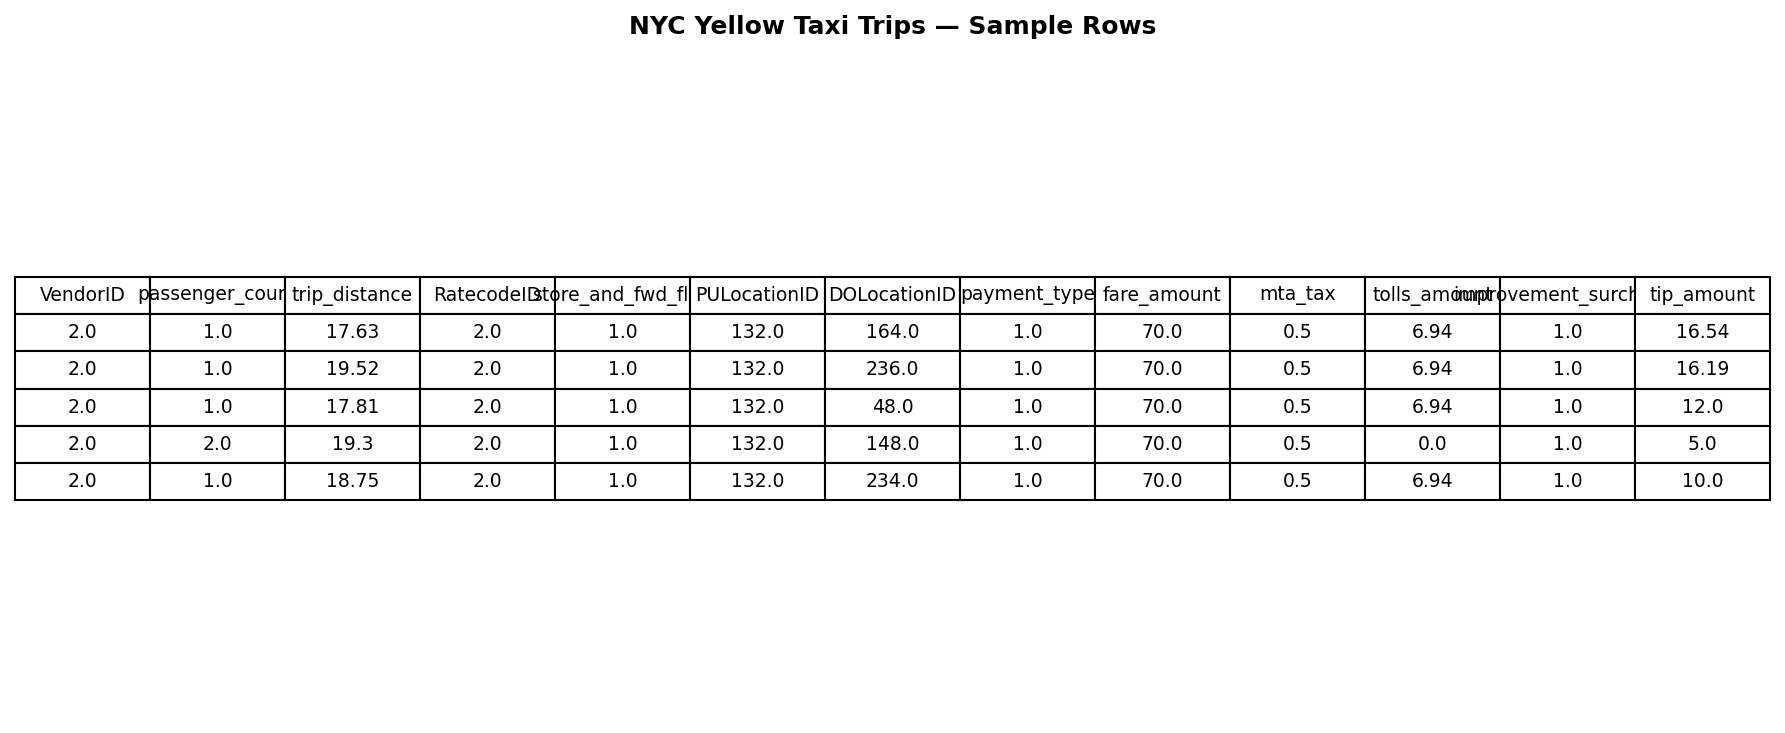
Feature correlation with tip_amount
correlation_values = raw_data.corr(numeric_only=True)['tip_amount'].drop('tip_amount')
ax = correlation_values.sort_values(key=lambda s: s.abs()).plot(kind='barh', figsize=(10, 6))
ax.set_xlabel('Correlation with tip_amount')
ax.set_title('Feature Correlation with tip_amount')
plt.tight_layout()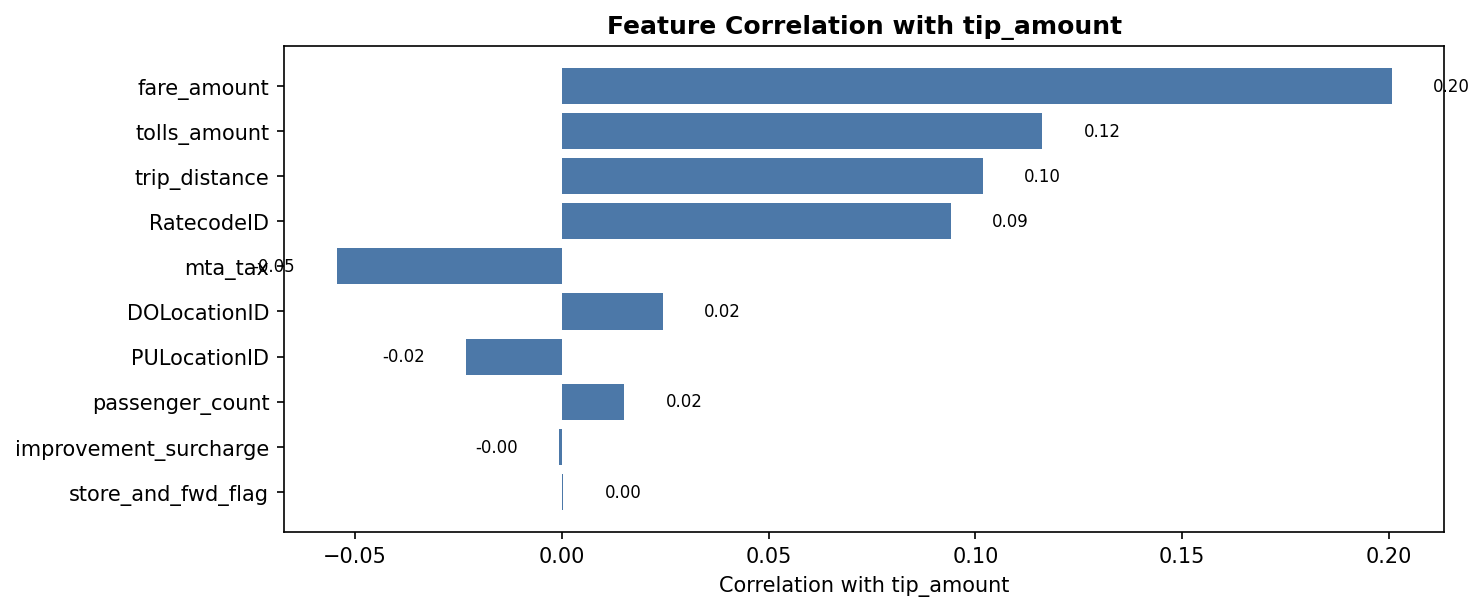
Preprocess, split, train model
# Extract labels and features
y = raw_data[['tip_amount']].values.astype('float32')
X = raw_data.drop(['tip_amount'], axis=1).values

# Normalize features (L1 across rows)
X = normalize(X, axis=1, norm='l1', copy=False)

# Train/test split
X_train, X_test, y_train, y_test = train_test_split(
    X, y, test_size=0.3, random_state=42
)

# Decision Tree Regressor
dt_reg = DecisionTreeRegressor(
    criterion='squared_error', max_depth=8, random_state=35
)
dt_reg.fit(X_train, y_train)

# Evaluate
y_pred = dt_reg.predict(X_test)
mse_score = mean_squared_error(y_test, y_pred)
r2_score = dt_reg.score(X_test, y_test)
print(f"MSE: {mse_score:.3f}\nR^2: {r2_score:.3f}")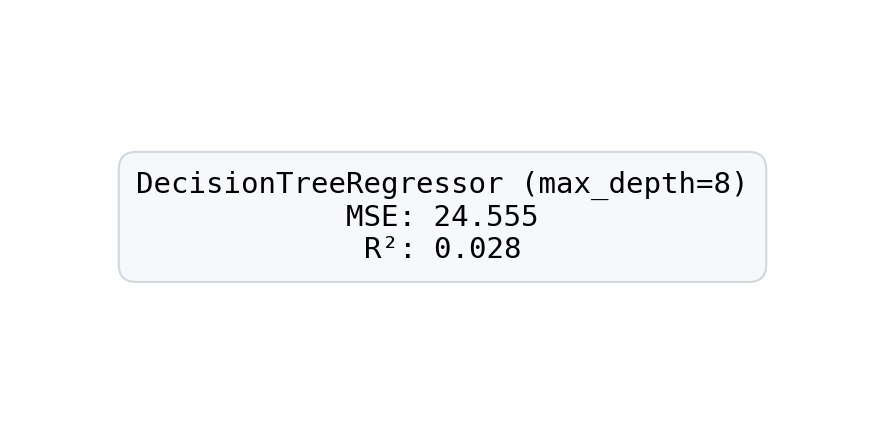
Top-3 correlated features (absolute)
correlation_values = raw_data.corr(numeric_only=True)['tip_amount'].drop('tip_amount')
top3 = correlation_values.abs().sort_values(ascending=False).head(3)
top3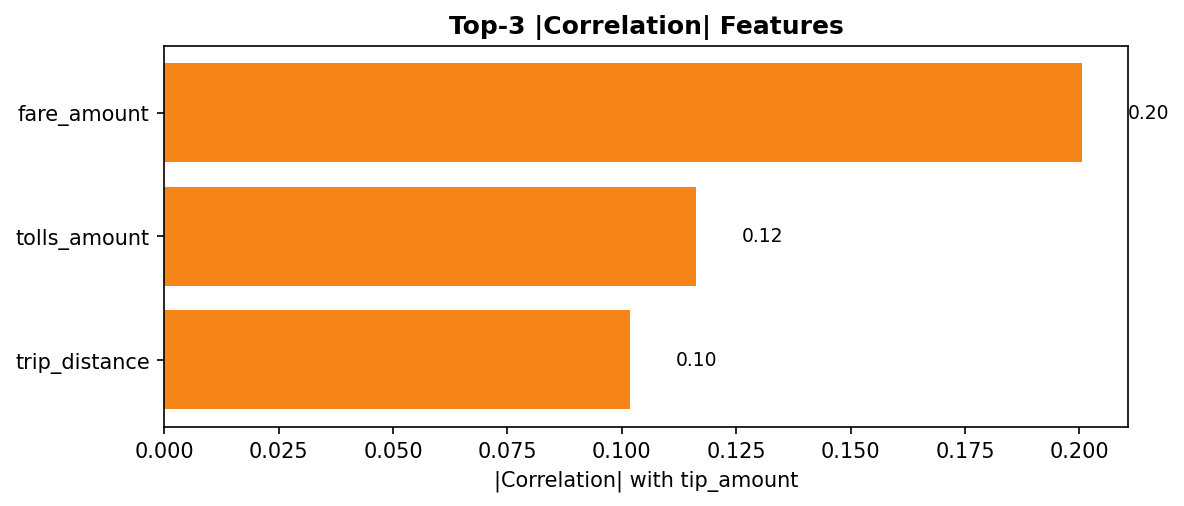
Ideas For Improvement
- Try different tree depths (e.g., max_depth=4 or 12) and observe how MSE and R² change.
- Remove low-correlation features (e.g., payment_type, VendorID, store_and_fwd_flag, improvement_surcharge) and compare results.
- Consider adding cross-validation and hyperparameter tuning for more robust performance estimates.